Stay up to date with handy news and offers\n","image":"https://cdn.greenmatch.co.uk/cdn-cgi/image/format=auto/2/2023/05/GM-UK-Price-Tag-2.png","text":"
Receive offers, marketing and promotions via email or phone from Leads.io about GreenMatch or our brands and affiliates to help you save.
\n","buttonYes":"Yes I'm in!","buttonNo":"No thanks, leave me out!"},"pinterestUrl":"https://www.pinterest.co.uk/greenmatchuk/","privacyCookiesPolicyUrl":"//www.azjdb.com/privacy-policy","covidUrl":null,"googleUa":"UA-43749553-10","businessHours":"
\n","footerSuffix":null,"translations":{"header":{"titleSuffix":"GreenMatch","menu":"Menu","menuOverview":"Overview","becomeAPartner":"Become a Partner","covid":"COVID-19"},"author":{"email":"Email","linkedin":"Profile on LinkedIn","twitter":"Profile on Twitter","website":"Website","writtenBy":"Written by","contributors":"Contributors:","expertReviewers":"Expert Reviewers:"},"ctaButton":{"button":"Get Quotes Now","description":"Fill in the form in just 1 minute"},"embedCode":{"get":"Get Embed Code","copy":"Copy","customWidth":"Custom width","videoHeading":"If you would like to use this video on your website, use the embed code below:","imageHeading":"If you would like to use this image on your website, use the embed code below:","infographicHeading":"If you would like to use this infographic on your website, use the embed code below:","iframeHeading":"If you would like to use this map on your website, use the embed code below:"},"quoteForm":{"error":"Something went wrong.","errorTryAgain":"Please try again.","errorContactSupport":"Please contact support.","errorCodeInvalid":"Invalid code.","privacyText":"
Your privacy is important to us. By submitting this form, you consent to Leads.io and up to 4 suppliers contacting you by email, web push, telephone (incl. automated calls) and/or SMS with details or quotes for your enquiry and such products, and/or to confirm your product requirements. You have certain rights in relation to your personal data, including the right to object to direct marketing.
\n","privacyCare":"We care about your privacy","privacyCookiesPolicyText":"Privacy policy","footerText":"It only takes 30 seconds\n100% free and with no obligation"},"iframeEmbedCode":{"createdBy":"Created by"},"readMore":{"text":"Read more"},"tableOfContents":{"defaultHeading":"Learn More in Our Guide"},"media":{"testimonials":{"text":"Media & Testimonials"},"mentionedIn":{"text":"Mentioned in"}},"becomePartner":{"title":"Become a Partner","text":"We strive to connect our customers with the right product and supplier. Would you like to be part of GreenMatch?","button":"Apply now"},"becomeAffiliate":{"title":"Become an Affiliate Partner"},"itsThatEasy":{"title":"It's That Easy"},"content":{"lastUpdated":"Last updated"},"footer":{"getInTouch":"Get in Touch","ownedBy":"Owned by Leads.io","disclaimer":"
Disclaimer: GreenMatch aims to provide information to users to help them to lead a more sustainable lifestyle. The content found on GreenMatch and its service are free for all users. We may, however, earn a commission from sales generated through our site. This has no additional cost to the users and does not affect their purchase. We earn a commission from the companies we collaborate with; this helps us run the site and keep our service free. You can read more about us here.
\n"},"moreOnThisTopic":{"title":"More on This Topic"},"relatedArticles":{"title":"Related Articles"},"topPages":{"title":"Top Pages"},"guide":{"title":"Learn More in Our Guide"},"authorArticles":{"more":"View more","close":"Close"},"blog":{"more":"View more","close":"Close","categories":"Categories","search":"Search","noMatch":"Your search did not match any blog posts"},"cookieConsent":{"button":"Change Cookie Settings","modalTitle":"We care about your privacy","modalText":"
You can change your preferred cookie settings below. Read more about our cookie policy here.
\n","modalAlwaysTitle":"Cookies that we always use","modalAlwaysText":"We use cookies that are necessary for the site to work. We also use cookies to monitor and track the performance of our marketing, monitor the use of our website, improve the user experience of our website, and track our website performance. If you want to avoid these cookies, please refer to our cookie policy for information on how to disable cookies in your browser.","modalAdsTitle":"Cookies for targeted ads","modalAdsText":"These cookies are used to track browsing habits and activity. We use this information and share it with third parties to enable us to show you relevant/personalised marketing content.","modalAdsTextOff":"
You have disabled targeted ads cookies and we will not use these cookies to provide you with relevant and personalised marketing content.
\n
If you at an earlier point have opted in for this type of cookies, either at our website or at any other website, you will likely have third party cookies in your browser that is being used to track your browsing behaviour. The following is a list of the third parties we collaborate with and a link to where you can opt opt of their personalised marketing programmes that we and other advertisers are using.
\n","modalButton":"Save and close","overlayTitle":"We use cookies to give you the best browsing experience.","overlayText":"
We and our partners use cookies on our website to improve your browsing experience, personalize content and ads, provide social media features, and analyze our traffic. If you continue interacting we assume that you are happy to receive all cookies on this website. However, you can change your cookie settings at any time at the bottom of this page. Read more about our cookie policy.
\n","overlayButton":"Save and close"},"whyUse":{"title":"Why Use GreenMatch?"},"productGuide":{"back":"Back"},"page404":{"title":"Sorry, We Can't Find That Page","topText":"
\n
…something went wrong or you might have followed an old link to a page that doesn’t exist anymore.
Need help? Please send an email to info@greenmatch.co.uk and we’ll do everything we can to help.
\n
\n","bottomText":"
This page might be broken, but we are here to save the day! \nDid you know that you can get up to 4 quotes from local renewable energy installers by using GreenMatch? \nClick on the button below and start exploring your options!
\n","button":"Get Renewable Energy Quotes"},"verifyModal":{"title":"Success!","text":"Your phone number is now verified. We will forward your request to installers who can help you. If we need more information, we will contact you by phone to complete your request."}},"media":{"testimonials":[{"url":"https://cdn.greenmatch.co.uk/cdn-cgi/image/format=auto/2/2023/01/wind-power.png","alt":"","width":135,"height":32},{"url":"https://cdn.greenmatch.co.uk/cdn-cgi/image/format=auto/2/2023/01/gtm.png","alt":"","width":66,"height":32},{"url":"https://cdn.greenmatch.co.uk/cdn-cgi/image/format=auto/2/2023/01/green-builder.png","alt":"","width":135,"height":24}],"mentionedIn":[{"url":"https://cdn.greenmatch.co.uk/cdn-cgi/image/format=auto/2/2023/04/guardian.png","alt":"The Guardian logo","width":99,"height":40},{"url":"https://cdn.greenmatch.co.uk/cdn-cgi/image/format=auto/2/2023/04/harvard.png","alt":"Harvard University logo","width":116,"height":40},{"url":"https://cdn.greenmatch.co.uk/cdn-cgi/image/format=auto/2/2023/04/independent.png","alt":"Independent logo","width":190,"height":40},{"url":"https://cdn.greenmatch.co.uk/cdn-cgi/image/format=auto/2/2023/04/space.png","alt":"SPACE.com logo","width":96,"height":40},{"url":"https://cdn.greenmatch.co.uk/cdn-cgi/image/format=auto/2/2023/04/forbes.png","alt":"Forbes logo","width":90,"height":40}]},"thatEasyPoints":[{"title":"Request Quotes","text":"Describe your requirements for the product in our form."},{"title":"Match","text":"We will match your request with suitable suppliers."},{"title":"Receive Quotes","text":"You will receive up to 4 quotes tailored to your needs."}],"footerBadges":[{"url":"https://cdn.greenmatch.co.uk/cdn-cgi/image/format=auto/2/2023/01/uk-blog-awards.png","alt":""},{"url":"https://cdn.greenmatch.co.uk/cdn-cgi/image/format=auto/2/2023/01/build-magazine.png","alt":""},{"url":"https://cdn.greenmatch.co.uk/cdn-cgi/image/format=auto/2/2023/01/sme-news-greenmatch.png","alt":""}],"buttonUrl404":"//www.azjdb.com/green-energy","image404":"https://cdn.greenmatch.co.uk/cdn-cgi/image/format=auto/2/2023/02/404_image.png","logoCondensed":"https://cdn.greenmatch.co.uk/cdn-cgi/image/format=auto/2/2023/02/logo-condensed.svg","quoteFormMarketingConsent":true},"themeSettings":{"colourBase200":"#9ec73d","colourBase400":"#72a201","colourBase600":"#628b01","colourBase800":"#4e6f01","backgroundImage":"https://cdn.greenmatch.co.uk/cdn-cgi/image/format=auto/2/2023/02/background.svg","interactiveChartH3":"#444444","interactiveChartGridline":"#dddddd","interactiveChartMain":"#9ec73d","interactiveChartAccent":"#f56a00","interactiveChartSecondary":"#3f99de"},"menus":{"headerMenu":{"name":"header","items":[{"name":"Solar Panels","url":"//www.azjdb.com/solar-energy/solar-panels","subMenu":[{"name":"Solar Panel Installation Cost","url":"//www.azjdb.com/blog/2014/08/what-is-the-installation-cost-for-solar-panels","subMenu":null},{"name":"Solar Panel Grants","url":"//www.azjdb.com/solar-energy/solar-panels/solar-panel-grants","subMenu":null},{"name":"Solar Water Heating","url":"//www.azjdb.com/solar-energy/solar-water-heating","subMenu":null},{"name":"Commercial Solar Panels","url":"//www.azjdb.com/solar-energy/solar-panels/commercial","subMenu":null},{"name":"Solar Battery","url":"//www.azjdb.com/blog/2018/07/solar-battery-storage-system-cost","subMenu":null},{"name":"Solar Thermal","url":"//www.azjdb.com/solar-energy/solar-thermal","subMenu":null}]},{"name":"Heat Pumps","url":"//www.azjdb.com/heat-pump","subMenu":[{"name":"Air Source Heat Pumps","url":"//www.azjdb.com/heat-pump/air-source-heat-pump","subMenu":null},{"name":"Ground Source Heat Pumps","url":"//www.azjdb.com/heat-pump/ground-source-heat-pumps-in-the-uk","subMenu":null},{"name":"Air to Water Heat Pump","url":"//www.azjdb.com/heat-pump/air-to-water-heat-pump","subMenu":null},{"name":"Air to Air Heat Pump","url":"//www.azjdb.com/heat-pump/air-to-air-heat-pump","subMenu":null},{"name":"Water Source Heat Pump","url":"//www.azjdb.com/heat-pump/water-source-heat-pump","subMenu":null},{"name":"Best Air Source Heat Pump Manufacturers","url":"//www.azjdb.com/blog/best-air-source-heat-pump-manufacturers","subMenu":null},{"name":"Heat Pump Grants","url":"//www.azjdb.com/heat-pump/heat-pump-grant","subMenu":null}]},{"name":"Boilers","url":"//www.azjdb.com/boilers","subMenu":[{"name":"Electric Combi Boilers","url":"//www.azjdb.com/boilers/combi-boilers/electric-combi-boilers","subMenu":null},{"name":"New Boiler Cost","url":"//www.azjdb.com/blog/2018/08/new-boiler-cost","subMenu":null},{"name":"Boiler Replacement","url":"//www.azjdb.com/blog/boiler-replacement","subMenu":null},{"name":"Combi Boiler Prices","url":"//www.azjdb.com/boilers/combi-boilers/combi-boiler-prices","subMenu":null},{"name":"Electric Boilers","url":"//www.azjdb.com/boilers/electric","subMenu":null},{"name":"Biomass Boiler Costs","url":"//www.azjdb.com/blog/2015/02/how-much-does-a-biomass-boiler-cost","subMenu":null}]},{"name":"Windows","url":"//www.azjdb.com/windows","subMenu":[{"name":"uPVC Windows","url":"//www.azjdb.com/windows/upvc","subMenu":null},{"name":"uPVC Windows Manufacturers","url":"//www.azjdb.com/windows/upvc/manufacturers","subMenu":null},{"name":"Double Glazed Windows","url":"//www.azjdb.com/windows/double-glazing","subMenu":null},{"name":"Best Double Glazing Company","url":"//www.azjdb.com/windows/double-glazing/companies","subMenu":null},{"name":"Window Prices","url":"//www.azjdb.com/windows/prices","subMenu":null},{"name":"Window Grants","url":"//www.azjdb.com/windows/grants","subMenu":null}]},{"name":"Doors","url":"//www.azjdb.com/doors","subMenu":[{"name":"uPVC Doors","url":"//www.azjdb.com/doors/upvc","subMenu":null},{"name":"Double Glazed Doors","url":"//www.azjdb.com/doors/double-glazed","subMenu":null},{"name":"Composite Doors","url":"//www.azjdb.com/doors/composite","subMenu":null}]},{"name":"Conservatory","url":"//www.azjdb.com/conservatory","subMenu":[{"name":"Conservatory Prices","url":"//www.azjdb.com/conservatory/cost","subMenu":[{"name":"Fully Fitted Conservatory Prices","url":"//www.azjdb.com/conservatory/cost/fully-fitted","subMenu":null}]},{"name":"Conservatory Companies Near Me","url":"//www.azjdb.com/conservatory/companies","subMenu":null},{"name":"Lean to Conservatory","url":"//www.azjdb.com/conservatory/lean-to","subMenu":null},{"name":"Replacement Conservatory","url":"//www.azjdb.com/conservatory/replacement","subMenu":null}]},{"name":"More","url":"","subMenu":[{"name":"Blog","url":"//www.azjdb.com/blog","subMenu":null},{"name":"About Us","url":"//www.azjdb.com/about-us","subMenu":null},{"name":"Scholarships","url":"//www.azjdb.com/scholarships","subMenu":null},{"name":"Become a Partner","url":"//www.azjdb.com/supplier-sign-up","subMenu":null},{"name":"Contributor Guidelines","url":"//www.azjdb.com/blog/contributor-guidelines","subMenu":null}]}]},"footer1Menu":{"name":"Popular Articles","items":[{"name":"How Many Solar Panels Do I Need?","url":"//www.azjdb.com/blog/how-many-solar-panels-do-i-need","subMenu":null},{"name":"Pros & Cons of Solar Energy","url":"//www.azjdb.com/blog/2014/08/5-advantages-and-5-disadvantages-of-solar-energy","subMenu":null},{"name":"Home Improvements That Add Value","url":"//www.azjdb.com/blog/2020/09/home-improvements","subMenu":null},{"name":"Running Cost of Heat Pumps","url":"//www.azjdb.com/blog/2014/08/the-running-costs-of-heat-pumps","subMenu":null},{"name":"Renewable Heat Incentive","url":"//www.azjdb.com/green-energy/grants/rhi","subMenu":null},{"name":"Gas Boiler Ban","url":"//www.azjdb.com/blog/gas-boiler-ban","subMenu":null}]},"footer2Menu":{"name":"About Us","items":[{"name":"About GreenMatch","url":"//www.azjdb.com/about-us","subMenu":null},{"name":"Authors and Contributors","url":"//www.azjdb.com/authors","subMenu":null},{"name":"GreenMatch Scholarships","url":"//www.azjdb.com/scholarships","subMenu":null},{"name":"Privacy Policy","url":"//www.azjdb.com/privacy-policy","subMenu":null},{"name":"Cookies","url":"//www.azjdb.com/cookie-policy","subMenu":null},{"name":"User Terms","url":"//www.azjdb.com/user-terms","subMenu":null},{"name":"Legal Notice","url":"//www.azjdb.com/legal-notice","subMenu":null}]}},"hasCookieConsentCookie":false,"title":"Mapped: Europe’s Most and Least Polluted Countries | GreenMatch","yoastHead":"\n\n\n\n\n\n\n\n\n\n\n\n\n\t\n\t\n\t\n\n\n\t\n\n","template":"content-and-sidebar.php","contentTitle":"Mapped: Europe’s Most and Least Polluted Countries","content":"\n
\n
Mapped: Europe’s Most and Least Polluted Countries
\n
\n\n\n\n
\n
The World Health Organization recently published a report saying that more than 90% of the world’s children are breathing in toxic air. Unfortunately, the world is polluted in more ways than one. With the increasing urgency of climate change and achieving Net Zero, it is important to understand the levels of pollution per country. Europe has the largest and wealthiest economy in the world. Nevertheless, there is a great diversity of pollution across the continent.
\n\n\n\n
To give insight into the pollution level in different countries in Europe, GreenMatch conducted a comprehensive study shining light on the 7 factors that affect pollution:
According to GreenMatch’s findings, Turkey is the most polluted, and Sweden is the cleanest European country.
\n\n\n\n
1. Turkey
\n\n\n
\n
\n\n\n
Turkey is the most polluted country in Europe with an overall score of 6.1/10. There are several arguments that resulted in this conclusion. As for the air in Turkey, the carbon dioxide pollution is 4.33 tonnes per capita per year, and the concentrations of PM2.5 are 41 µg/m3. In relation to this, there are 44 deaths attributable to air pollution per 100,000 capita per year. To compensate for the pollution, Turkey consists of only 15.2% forest area and has just 0.2% protected terrestrial or marine area. Turkey discards 424.625 kg of waste per capita each year.
\n\n\n\n
2. Poland
\n\n\n
\n
\n\n\n
Poland takes second place with an overall score of 5.5/10. The carbon dioxide emissions in poland are 7.63 tonnes per capita per year, which is higher than the winner Turkey. The concentrations of PM2.5 are 22 µg/m3 which is almost half of Turkey’s concentrations. There are 69 deaths attributable to air pollution per 100,000 capita per year. Poland consists of 30.8% forest area and 38.10% protected terrestrial and marine area. Each year, the citizens of Poland discard 304.9 kg of waste per capita.
\n\n\n\n
3. Latvia
\n\n\n
\n
\n\n\n
Latvia scores a close 5.4/10 behind Poland. Carbon dioxide emissions are 3.47 tonnes per capita per year, which is the lowest amount of all the countries in this study. Next to that, concentrations of PM2.5 are 14 µg/m3 in relation to the highest number of deaths attributable to air pollution of 91 per 100,000 capita per year. The waste discarded each year is 407.2 kg per capita.
\n\n\n\n
The Cleanest Countries
\n\n\n\n
1. Sweden
\n\n\n
\n
\n\n\n
The least polluted country is Sweden with overall score of 2.8/10. The amount of carbon dioxide is 3.83 tonnes per capita per year, and the concentrations of PM2.5 are 6 µg/m3. The deaths attributable to air pollution consist of 0.4 per 100,000 capita per year. Next to that the country consists of 68.9% forest area and 15% protected terrestrial or marine area. Sweden discards 446.505 kg of waste per capita. Even though, this amount is higher than the amount of waste in Turkey, Sweden is doing much better on all the other metrics.
\n\n\n\n
2. Finland and France
\n\n\n
\n
\n\n\n
Finland shares second place with France with a score of 3.5/10.
\n\n\n\n
Finland’s carbon dioxide emissions are 8.28 tonnes per capita per year. The PM2.5 concentrations are 7 µg/m3 per year in relation to 6 deaths per 100,000 capita per year. Finland consists of 73.1% forest area and 14.2% protected terrestrial and marine area. The waste discarded each year amounts to 502.974 kg per capita.
\n\n\n\n
\n\n\n\n
For France, carbon dioxide emissions are 4.38 tonnes per capita per year.
\n\n\n
\n
\n\n\n
The concentrations of PM2.5 are 12 µg/m3 per year next to an amount of 17 deaths per 100,000 capita per year attributable to air pollution. France consists of 31% forest area and 33.2% protected terrestrial and marine area. The amount of waste discarded each year is 512.498 kg per capita.
\n\n\n\n
Provided that France is one of the leading countries in terms renewable energy solutions, like solar panel installations, it should come as no surprise that they are ranking in the top of our list.
\n\n\n\n
The UK vs. Europe
\n\n\n\n
The UK takes a middle standpoint with and overall score of 4.3/10, which is 0.25 better than the European average. The comparison within the particular metrics is presented in the table below:
\n\n\n\n
UK vs. the Europe’s Average
Metric
UK’s Result
Europe’s Average
Carbon dioxide emissions from fuel combustion (tCO2/capita/year)
5.65
6.70
Annual mean concentration of PM2.5 in urban areas (ug/m3)
11.00
13.36
Deaths attributable to air pollution, per 100,000 capita per year (crude rate)
26.00
35.00
Waste (kg/capita/year)
481.59
500.90
Forest area (% of total land)
13.00
34.40
Forest and marine protected area (% of total land)
28.80
22.01
\n\n\n\n
Additionally, here’s a green region checker tool that you can use if you want to find out how green is your region in the UK.
The Top 5 Most and Least Polluted Countries per Metric
\n\n\n\n
The overall results show that Turkey performs the worst and Sweden performs the best. Yet, each country performs differently per metric.
\n\n\n\n
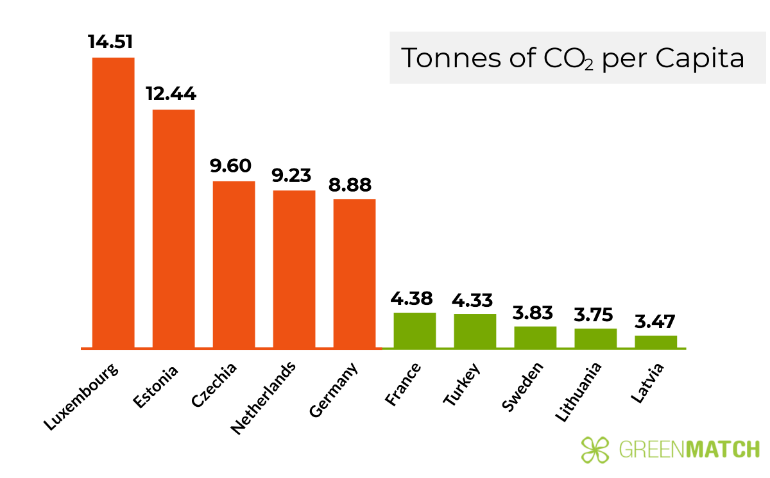
CO2 emissions are the highest for Luxembourg with 14.51 tonnes per capita and the lowest for Latvia with a 3.47 tonnes per capita.
\n\n\n
\n
\n\n\n
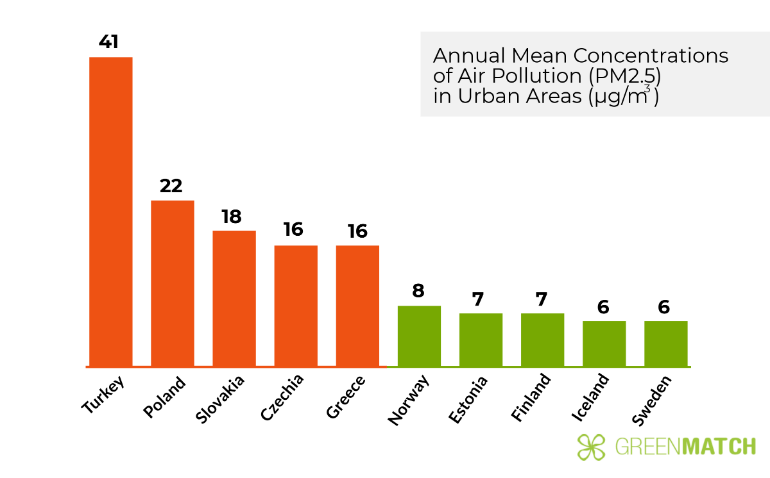
Turkey ranks the highest for air pollution with a 41 μg/m3 where Sweden has the lowest value of 6 μg/m3. The World Health Organization guideline limits the annual mean of PM2.5 concentrations at 10 μg/m3.
\n\n\n
\n
\n\n\n
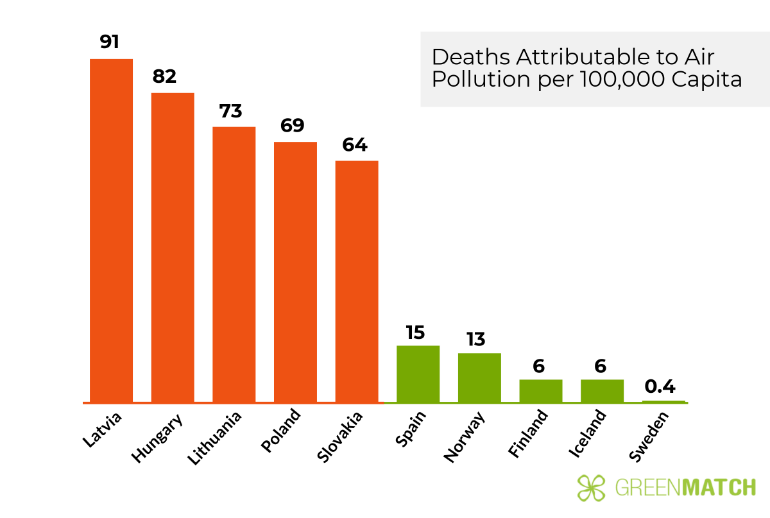
Latvia has the highest death rate attributable to air pollution with a 91 per 100,000 capita while Sweden has a death rate of 0.4 per 100,000 capita.
\n\n\n
\n
\n\n\n
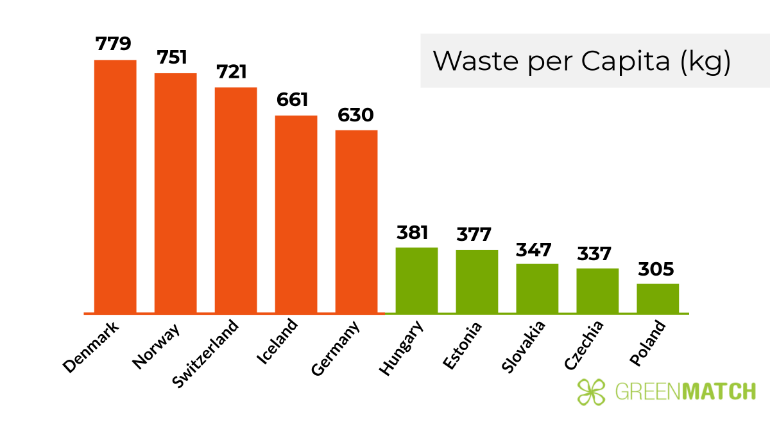
Denmark discards the most waste with an amount of 779 kg per capita per year where Poland discards less than half with an amount of 305 kg per capita each year.
\n\n\n
\n
\n\n\n
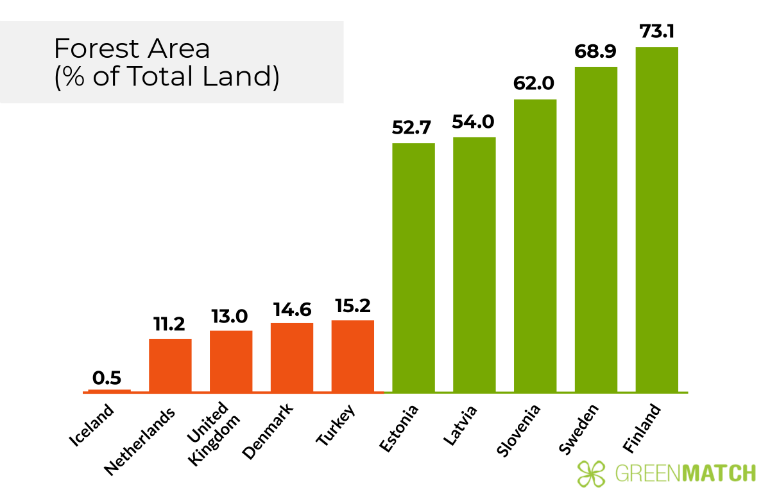
Iceland has the lowest percentage of forest area with 0.5% of the total land compared to Finland that consists of 73.1% forest area.
To find the most polluted countries in the EU, 24 member states of the EU and the UK were analysed based on 7 metrics. The reason for analysing only 24 member states is due to the missing data for some countries. The following metrics were used in the analysis:
\n\n\n\n
Yearly carbon dioxide emissions from fuel combustion per capita
Annual mean concentrations of PM2.5 in urban areas
Yearly deaths attributable to air pollution per 100,000 capita
The quality of designated drinking water sources
Yearly amount of waste per capita
Forest area as % of total land
Terrestrial and marine protected area as % of total land
\n\n\n\n
Of these metrics, carbon dioxide emissions, mean concentrations of PM2.5, and deaths attributable to air pollution were weighted double. The reason is that carbon dioxide is the main and most harmful pollutant that is warming Earth. After which, the pollutant PM2.5 poses the greatest health risks to people which in relation to the deaths attributable to air pollution emphasize the extreme consequence of pollution.
\n\n\n\n
Dimensions
\n\n\n\n
Yearly Carbon Dioxide Emissions from Fuel Combustion
\n\n\n\n
This metric represents the yearly share of CO2 emissions that an individual produces via fuel combustion. The tons of CO2 emissions per capita per year.
\n\n\n\n
Annual Mean Concentrations of PM2.5 in Urban Areas
\n\n\n\n
PM2.5 poses the greatest health risks out of all pollutants. PM2.5 is the name of a Particulate Matter with a diameter of 2.5 μm. Because of the smalls size of this particulate matter, it can easily be breathed in through the nose and throat after which it can penetrate deep into the lungs and sometimes even enter the circulatory system. WHO has an annual guideline limit of 10 μg/m3.
\n\n\n\n
This metric indicates the annual mean concentrations of PM2.5 (μg/m3) in urban areas since the concentrations of PM2.5 pollution are the highest there.
\n\n\n\n
Deaths Attributable to Air Pollution
\n\n\n\n
This study uses the crude rate (per 100,000 capita) which shows the deaths attributable to air pollution per year.
\n\n\n\n
The Quality of Designated Drinking Water Sources
\n\n\n\n
Drinking water is an important measure for pollution since we cannot live without water. Overall, drinking water sources in Europe are good, and the water is clean and safe to consume. However, in some countries its quality is lower than in the others.
\n\n\n\n
Waste per Capita
\n\n\n\n
This measure shows the amount of waste in kilograms that is discarded each year per individual.
\n\n\n\n
Forest Areas
\n\n\n\n
Vegetation is a good compensation measure for most pollution. The most clear way to show the level of vegetation per country is the percentage of forest areas of the total land of a country.
\n\n\n\n
Terrestrial and Marine Protected Area
\n\n\n\n
A country can have a lot of forest or vegetation areas but if these aren’t protected than these can be removed.
\n\n\n\n
Dataset
\n\n\n\n\n\n\n\n\n\n
\n\n\n\n
\n\n\n\n\n\n\n
\n","lastUpdated":"10 February 2023","topBanner":null,"pageHeader":{"title":"Making the UK greener, one house at a time","type":"text","subtitle":"","media_type":"testimonials"},"breadcrumbs":{"0":{"name":"GreenMatch","url":"//www.azjdb.com/"},"1":{"name":"Blog","url":"//www.azjdb.com/blog"},"4":{"name":"Mapped: Europe’s Most and Least Polluted Countries","url":null}},"authors":[],"relatedArticles":[{"id":29207,"url":"//www.azjdb.com/blog/2014/04/find-a-green-energy-tariff-vol-1","image":"","title":"Find a Green Energy Tariff vol. 1"},{"id":29209,"url":"//www.azjdb.com/blog/2014/04/find-a-green-energy-tariff-vol-2","image":"https://cdn.greenmatch.co.uk/cdn-cgi/image/format=auto/2/2022/10/green_tariff_vol2.jpg","title":"Find a Green Energy Tariff vol. 2"},{"id":29218,"url":"//www.azjdb.com/blog/2014/06/guide-is-economy-7-the-best-saving-solution","image":"https://cdn.greenmatch.co.uk/cdn-cgi/image/format=auto/2/2022/10/onlineblog_economy7_noinsulation.jpg","title":"Guide: Is Economy 7 The Best Saving Solution?"},{"id":29250,"url":"//www.azjdb.com/blog/2014/07/the-green-deal-all-you-need-to-know","image":"https://cdn.greenmatch.co.uk/cdn-cgi/image/format=auto/2/2022/10/greenuk.jpg","title":"The Green Deal – All You Need To Know"}],"subPages":[],"topPages":[],"hideMoreOnThisTopic":false,"hideItsThatEasy":false,"hideBecomeAPartner":false,"hideContentHeader":false,"guideLinks":[{"title":"Interactive Map","link":"Map"},{"title":"Overall Results","link":"Most"},{"title":"UK vs. the Rest of Europe","link":"UK"},{"title":"Top 5 Most and Least Polluted Countries per Metric","link":"Top-Metric"},{"title":"Methodology and Dimensions","link":"Methodology"},{"title":"Dataset","link":"Dataset"}]},"url":"/blog/2018/11/mapped-europes-most-and-least-polluted-countries","version":"a0089c9c8d397ad636ca5d57e901096b"}">


 我们努力为客户提供合适的产品和供应商联系。你想成为GreenMatch的一部分吗?